

Tracking Spam
This graph shows the amount of spam deleted from my mailbox, on a weekly basis, for the past eighteen months (by a despamming program for POP mailboxes, based on SpamBayes). The volumes plotted are less than actually found, as only those mails with a score of 90% spamness are counted.
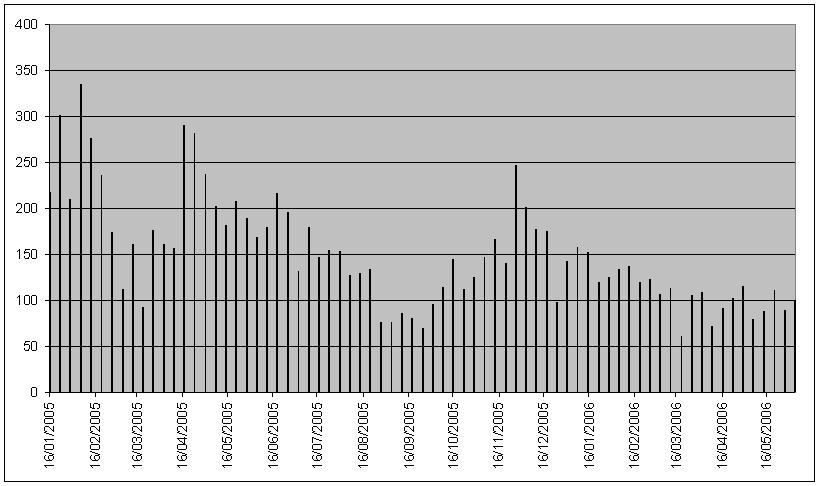
The volume variation over the last 18 months is interesting, but I'm not sure what to read into it, apart from spammers look like they have late summer holidays.
